Visualization
of advanced graph algorithms
Push-Relabel algorithm
solves the maximum flow problemLabel-Setting algorithm
solves the shortest path problem with resource constraints (SPPRC)IDP of Adrian Haarbach
Previous work
multiple IDP's
e.g.
Canvas
The canvas element is part of HTML5 and allows for dynamic, scriptable rendering of 2D shapes and bitmap images. It is a low level, procedural model that updates a bitmap and does not have a built-in scene graph. from wikipedialow level
drawing operations
/**
 * @author Mark J. Becker
 * Funktionen in dieser Datei werden dazu genutzt,
 * Formen auf das Canvas zu zeichnen
 */

/**
 * Klasse mit Funktionen, um den Graph auf das Canvas zu zeichnen.
 * Die Funktionen in dieser Klasse sind allesamt statisch
 * @class
 */
function CanvasDrawMethods() {};

/**
 * Zeichne Pfeil an Kante
 * @param  {Object} ctx             2dContext des Canvas
 * @param  {Object} layout          Layout der Kante
 * @param  {Object} source          Koordinaten des Ausgangspunkts
 * @param  {Object} target          Koordinaten des Zielpunkts
 * @param  {String} label           Text
 * @param  {String} additionalLabel Zusätzlicher Text
 */
CanvasDrawMethods.drawArrowAtPosition = function(ctx,layout,source,target,label,additionalLabel) {
    if(!layout.progressArrow) {
        return;
    }
    var arrowHeadColor = const_Colors.EdgeHighlight2;
    // Pfeilkopf zeichnen
    ctx.beginPath();
    ctx.strokeStyle = arrowHeadColor;
    ctx.lineWidth = 4.0;
    var position = layout.progressArrowPosition || 0.0;
    var center = {x: (source.x + (target.x - source.x) * position), y: (source.y + (target.y - source.y) * position)};
    var edgeAngle = Math.atan2(target.y-source.y,target.x-source.x);
    var arrowStart = {x:center.x+ Math.cos(edgeAngle)* layout.arrowHeadLength/2,y:center.y+ Math.sin(edgeAngle) * layout.arrowHeadLength/2};
    var lineAngle1 = Math.atan2(target.y-source.y,target.x-source.x)
            + layout.arrowAngle + Math.PI;  // Winkel des rechten Pfeilkopfs relativ zum Nullpunkt
    var lineAngle2 = Math.atan2(target.y-source.y,target.x-source.x)
            - layout.arrowAngle + Math.PI;  // Winkel des linken Pfeilkopfs relativ zum Nullpunkt
    ctx.moveTo(arrowStart.x, arrowStart.y);
    ctx.lineTo(arrowStart.x + Math.cos(lineAngle1) * layout.arrowHeadLength, arrowStart.y + Math.sin(lineAngle1) * layout.arrowHeadLength);
    ctx.stroke();
    ctx.moveTo(arrowStart.x, arrowStart.y);
    ctx.lineTo(arrowStart.x + Math.cos(lineAngle2) * layout.arrowHeadLength, arrowStart.y + Math.sin(lineAngle2) * layout.arrowHeadLength);
    ctx.stroke();
}

/**
 * Zeichnet einen Pfeil, wobei die Pfeilspitze in der Mitte ist.

 * Falls der Pfeil als "Highlighted" gekennzeichnet ist wird, so wird ein kleinerer
 * Pfeil auf den großen Pfeil in anderer Farbe gezeichnet.
 * @param {Object} ctx              2dContext des Canvas
 * @param {Object} layout           Layout des Pfeils
 * @param {Object} source           Koordinaten des Ausgangspunkts
 * @param {Object} target           Koordinaten des Zielpunkts
 * @param {String} label            Text auf dem Pfeil
 * @param {String} additionalLabel  Zusatztext zu dem Pfeil
 */
CanvasDrawMethods.drawArrow = function(ctx,layout,source,target,label,additionalLabel) {
    // Linie zeichnen
    CanvasDrawMethods.drawLine(ctx,layout,source,target);
    var arrowHeadColor = layout.lineColor;

    if(layout.isHighlighted) {
        arrowHeadColor = const_Colors.EdgeHighlight3;
    }

    // Pfeilkopf zeichnen
    ctx.beginPath();
    ctx.strokeStyle = arrowHeadColor;
    //var position = 0.0;
    var center = {x: (target.x+source.x)/2, y:(target.y+source.y)/2};
    //var center = {x: (source.x + (target.x - source.x) * position), y: (source.y + (target.y - source.y) * position)};
    var edgeAngle = Math.atan2(target.y-source.y,target.x-source.x);
    var arrowStart = {x:center.x+ Math.cos(edgeAngle)* layout.arrowHeadLength/2,y:center.y+ Math.sin(edgeAngle)* layout.arrowHeadLength/2};
    var lineAngle1 = Math.atan2(target.y-source.y,target.x-source.x)
            + layout.arrowAngle + Math.PI;	// Winkel des rechten Pfeilkopfs relativ zum Nullpunkt
    var lineAngle2 = Math.atan2(target.y-source.y,target.x-source.x)
            - layout.arrowAngle + Math.PI;	// Winkel des linken Pfeilkopfs relativ zum Nullpunkt
    ctx.moveTo(arrowStart.x, arrowStart.y);
    ctx.lineTo(arrowStart.x + Math.cos(lineAngle1) * layout.arrowHeadLength,arrowStart.y + Math.sin(lineAngle1) * layout.arrowHeadLength);
    ctx.stroke();
    ctx.moveTo(arrowStart.x, arrowStart.y);
    ctx.lineTo(arrowStart.x + Math.cos(lineAngle2) * layout.arrowHeadLength,arrowStart.y + Math.sin(lineAngle2) * layout.arrowHeadLength);
    ctx.stroke();
    if(layout.isHighlighted) {
        var thirtyPercent = {x: 0.3*target.x + 0.7*source.x,
                             y: 0.3*target.y + 0.7*source.y};
        CanvasDrawMethods.drawLine(ctx,{lineColor:arrowHeadColor, lineWidth:layout.lineWidth},thirtyPercent,arrowStart);
    }
    if(label) {
        CanvasDrawMethods.drawTextOnLine(ctx,layout,source,target,label);
    }
    if(additionalLabel) {
        CanvasDrawMethods.drawAdditionalTextOnLine(ctx,layout,source,target,additionalLabel);
    }
};

/**
 * Zeichnet einen Linie in 2D
 * @param {Object} ctx           2dContext des Canvas
 * @param {Object} layout        Layout der Linie
 * @param {Object} source        Koordinaten des Ausgangspunkts
 * @param {Object} target        Koordinaten des Zielpunkts
 */
CanvasDrawMethods.drawLine = function(ctx,layout,source,target) {
    // Linie zeichnen
    ctx.beginPath();
    ctx.moveTo(source.x, source.y);
    ctx.lineTo(target.x,target.y);
    ctx.strokeStyle = layout.lineColor;
    ctx.lineWidth = layout.lineWidth;
    ctx.stroke();
};

/**
 * Zeichnet einen Text auf eine Linie.
 * Der Text wird ensprechend gedreht.
 * @param {Object} ctx           2dContext des Canvas
 * @param {Object} layout        Layout des Pfeils
 * @param {Object} source        Koordinaten des Ausgangspunkts
 * @param {Object} target        Koordinaten des Zielpunkts
 * @param {String} label         Text
 */
CanvasDrawMethods.drawTextOnLine = function(ctx,layout,source,target,label) {
    ctx.save();								// Aktuellen Zustand speichern (vor den Transformationen)
    ctx.font = layout.fontSize.toString() +"px " +layout.font;
    var arrowHeight = Math.sin(layout.arrowAngle)*layout.arrowHeadLength;
    var arrowWidth = Math.cos(layout.arrowAngle)*layout.arrowHeadLength;
    var labelMeasure = ctx.measureText(label);
    var alpha = Math.atan2(target.y-source.y,target.x-source.x);
    var center = {x: (target.x+source.x)/2, y:(target.y+source.y)/2};
    ctx.translate(center.x, center.y);
    ctx.rotate(alpha);
    if(Math.abs(alpha)>Math.PI/2) {					// Verhindere, dass Text auf dem Kopf angezeigt wird.
        ctx.translate(0, layout.fontSize/2);				// Gehe in die Mitte des Texts
        ctx.rotate(Math.PI);				// Rotiere um 180 Grad
        ctx.fillText(label, -arrowWidth/2, layout.fontSize+3+layout.lineWidth +arrowHeight);		// Schreibe Text an Position
    }
    else {
        ctx.fillText(label, -labelMeasure.width/2, -3-arrowHeight);									// Verschriebung um 3, um nicht zu nah am Pfeil zu sein.
    }
    ctx.restore();							// Ursprünglichen Zustand wiederherstellen.
};

/**
 * Zeichnet einen Zusatztext auf eine Linie.

 * Der Text wird ensprechend gedreht und umkreist.
 * @param {Object} ctx           2dContext des Canvas
 * @param {Object} layout        Layout des Pfeils
 * @param {Object} source        Koordinaten des Ausgangspunkts
 * @param {Object} target        Koordinaten des Zielpunkts
 * @param {String} label         Text
 */
CanvasDrawMethods.drawAdditionalTextOnLine = function(ctx,layout,source,target,label) {
    ctx.save();								// Aktuellen Zustand speichern (vor den Transformationen)
    ctx.font = layout.fontSize.toString() +"px " +layout.font;
    ctx.fillStyle = layout.lineColor;
    ctx.strokeStyle = layout.lineColor;
    var arrowHeight = Math.sin(layout.arrowAngle)*layout.arrowHeadLength;
    var arrowWidth = Math.cos(layout.arrowAngle)*layout.arrowHeadLength;
    var labelMeasure = ctx.measureText(label);
    var alpha = Math.atan2(target.y-source.y,target.x-source.x);
    var viertel = {x: 0.25*target.x+0.75*source.x, y:0.25*target.y+0.75*source.y};
    ctx.translate(viertel.x, viertel.y);
    ctx.rotate(alpha);
    if(Math.abs(alpha)>Math.PI/2) {			// Verhindere, dass Text auf dem Kopf angezeigt wird.
        ctx.translate(0, layout.fontSize/2);		// Gehe in die Mitte des Texts
        ctx.rotate(Math.PI);				// Rotiere um 180 Grad
        ctx.fillText(label, -labelMeasure.width/2, layout.fontSize+3+layout.lineWidth +arrowHeight);		// Schreibe Text an Position
        ctx.beginPath();
        ctx.arc(0,layout.fontSize/2+6+layout.lineWidth +arrowHeight, 0.8*layout.fontSize, 0, Math.PI*2, true);
    }
    else {
        ctx.fillText(label, -labelMeasure.width/2, -layout.fontSize+12-layout.lineWidth -arrowHeight);		// Schreibe Text an Position
        ctx.beginPath();
        ctx.arc(0,-layout.fontSize/2-layout.lineWidth -arrowHeight, 0.8*layout.fontSize, 0, Math.PI*2, true);
    }
    ctx.lineWidth = 1;
    ctx.stroke();
    ctx.restore();							// Ursprünglichen Zustand wiederherstellen.
};

/**
 * Zeichnet eine gefüllten Kreis an gegebener Position.
 * In den Kreis kann ein Text geschrieben werden.
 * @param {Object} ctx           2dContext des Canvas.
 * @param {Object} position      Ort, an dem der Knoten erstellt werden soll.
 * @param {Object} layout        Aussehen des Knotens.
 * @param {String} label         Beschriftung des Knotens.
 */

CanvasDrawMethods.drawDisk = function(ctx,position,layout,label) {
    ctx.beginPath();
    // Zeichne Füllung
    ctx.fillStyle =  layout.fillStyle;
    ctx.arc(position.x, position.y, layout.nodeRadius, 0, Math.PI*2, true);
    ctx.fill();
    // Zeichne Rand
    ctx.lineWidth = layout.borderWidth;
    ctx.strokeStyle = layout.borderColor;
    ctx.stroke();
    // Zeichne NodeID in den Knoten
    ctx.fillStyle = layout.fontColor;
    ctx.font = layout.font + " " +layout.fontSize.toString() + "px sans-serif";
    // Text sollte maximal so breit sein, dass er in den Knoten passt.
    var labelMeasure = Math.min(ctx.measureText(label).width,layout.nodeRadius*1.7);
    ctx.fillText(label, position.x-labelMeasure/2, position.y+layout.nodeRadius-layout.borderWidth-layout.fontSize/2,layout.nodeRadius*1.7);
};
bitmap
resolution bound, not scalable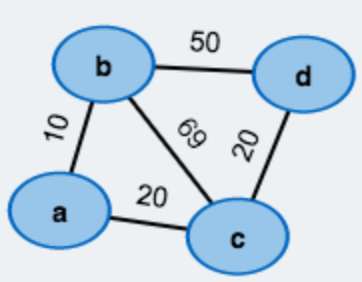
no scene graph
instead just 1 DOM element

no scene graph
hard to interact with visual elements
canvas.on("click", function(e) {
    var mx = e.pageX - canvas.offset().left;
    var my = e.pageY - canvas.offset().top;
    for(var knotenID in graph.nodes) {
        if (graph.nodes[knotenID].contains(mx, my)) {
            alert("clicked on node " + knotenId);
            return;
        }
    }
    for(var kantenID in graph.edges) {
        if (graph.edges[kantenID].contains(mx, my, canvas.getContext("2d"))) {
        	alert("clicked on edge " + kantenID);
            return;
        }
    }
    alert("clicked on empty space in canvas");
}

/**
 * Zeigt, ob sich die gegebenen Koordinaten auf der Kante befinden.
 * @method
 * @param {Number} mx				x-Koordinate
 * @param {Number} my				y-Koordinate
 * @this {GraphNode}
 * @return {Boolean}
 */
GraphNode.prototype.contains = function(mx, my) {
    var coord = this.getCoordinates();
    var radius = this.getLayout().nodeRadius;
    return (mx-coord.x)*(mx-coord.x) + (my-coord.y)*(my-coord.y) < radius*radius;
};

/**
 * Zeigt, ob sich die gegebenen Koordinaten auf der Kante befinden.
 * Es wird geprüft ob der Mausklick nah genug (innerhalb einer Toleranz) an der Kante war.
 * @param {Number} mx				x-Koordinate
 * @param {Number} my				y-Koordinate
 * @param {Object} ctx				Kontext des aktuellen Canvas
 * @this {Edge}
 * @returns {Boolean}
 * @method
 */
Edge.prototype.contains = function(mx,my,ctx) {
    var toleranz = 7;									// Wie viele Punkte entfernt von der Kante darf man klicken?
    var sourceC = this.getSourceCoordinates();
    var targetC = this.getTargetCoordinates();
    var alpha = Math.atan2(targetC.y-sourceC.y,targetC.x-sourceC.x);
    // Ist der Mauszeiger auf der Kante?

    var MouseShift = {x:mx-sourceC.x,y:my-sourceC.y};
    var MouseShiftRot = {x: MouseShift.x*Math.cos(-alpha) - MouseShift.y*Math.sin(-alpha),
                y: MouseShift.x*Math.sin(-alpha) + MouseShift.y*Math.cos(-alpha)};
    var targetShift = {x:targetC.x-sourceC.x,y:targetC.y-sourceC.y};
    var targetShiftRot = {x:targetShift.x*Math.cos(-alpha) - targetShift.y*Math.sin(-alpha),
                y:targetShift.x*Math.sin(-alpha) + targetShift.y*Math.cos(-alpha)};
    if(MouseShiftRot.x>=0 && MouseShiftRot.x<=targetShiftRot.x && Math.abs(MouseShiftRot.y)<=toleranz) {
        return true;
    }

    // Ist der Mauszeiger auf dem Text?
    var center = {x: (targetC.x+sourceC.x)/2, y:(targetC.y+sourceC.y)/2};
    var labelWidth = ctx.measureText(this.weight.toString()).width;
    var arrowHeight = Math.sin(this.getLayout().arrowAngle)*this.getLayout().arrowHeadLength;
    var c0 = {x:center.x+Math.cos(alpha)*labelWidth/2,
        y:center.y+Math.sin(alpha)*labelWidth/2};
    var c1 = {x:center.x-Math.cos(alpha)*labelWidth/2,
        y:center.y-Math.sin(alpha)*labelWidth/2};
    var c11 = {x:c1.x + Math.cos(alpha + Math.PI/2)*(-3-arrowHeight-this.getLayout().fontSize),
                y:c1.y + Math.sin(alpha + Math.PI/2)*(-3-arrowHeight-this.getLayout().fontSize)};
    var upperCornerOld = {x:c11.x-c0.x,y:c11.y-c0.y};
    var upperCorner = {x:upperCornerOld.x*Math.cos(-alpha) - upperCornerOld.y*Math.sin(-alpha),
                y:upperCornerOld.x*Math.sin(-alpha) + upperCornerOld.y*Math.cos(-alpha)};

    var rotatedMouseOld = {x:mx-c0.x,y:my-c0.y};
    var rotatedMouse = {x: rotatedMouseOld.x*Math.cos(-alpha) - rotatedMouseOld.y*Math.sin(-alpha),
                y: rotatedMouseOld.x*Math.sin(-alpha) + rotatedMouseOld.y*Math.cos(-alpha)};
    if(rotatedMouse.x <=0 && rotatedMouse.x>= upperCorner.x && rotatedMouse.y<=0 && rotatedMouse.y>= upperCorner.y) {
        return true;
    }
    return false;
};
My work
1 IDP, 2 algorithms
Common need:
2nd visualization layer- Push-Relabel algorithm
- height function of each node
- Label-Setting algorithm
- labels of paths
- pareto frontiers of all labels resident in a node
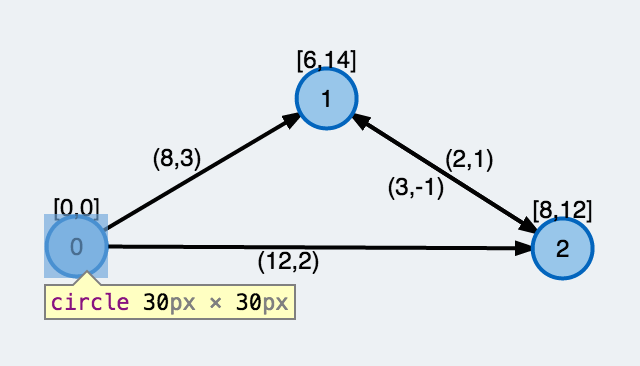
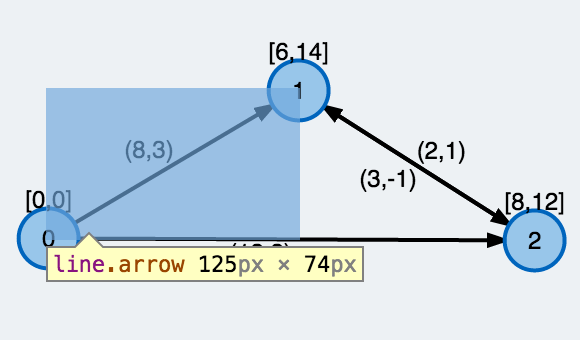
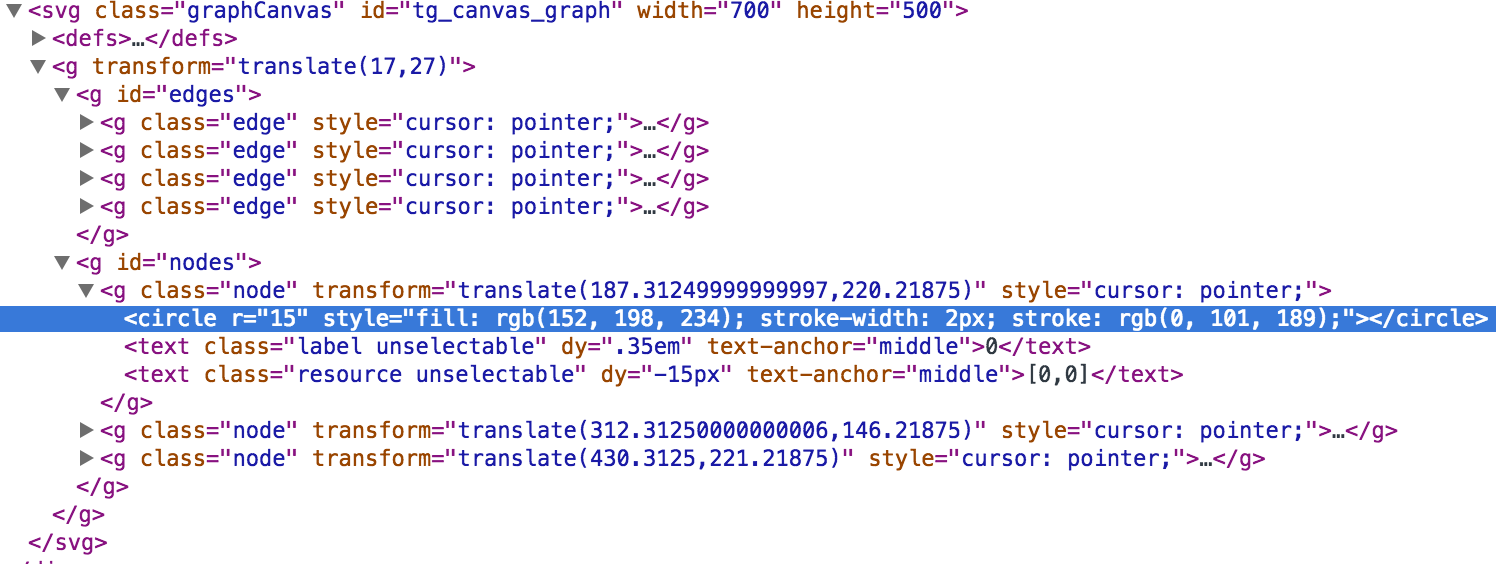
technology #1: SVG
Unlike low-level canvas, which is raster-based, high-level SVG is vector-based, i.e., each drawn shape is remembered as an object in a scene graph in the DOM. This means that if attributes of an SVG object are changed, the browser can automatically re-render the scene. The SVG scene graph enables event handlers to be associated with objects , so a rectangle may respond to an onClick event.
from wikipedia
high-level
drawing operations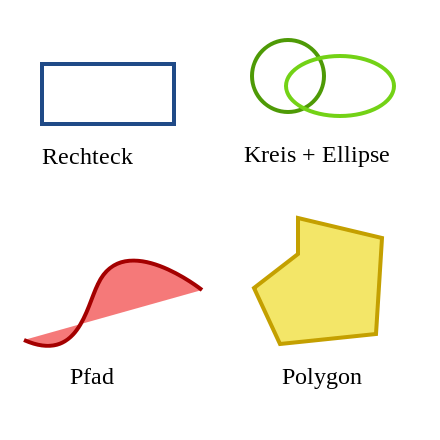
vector-based
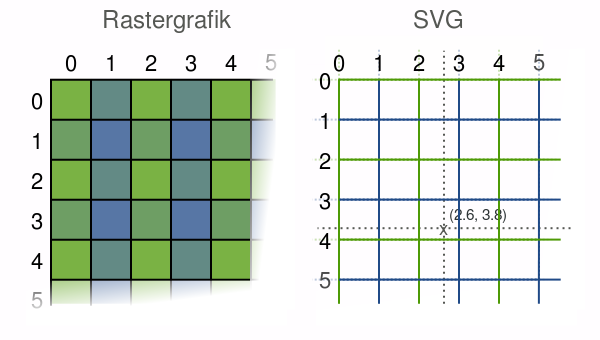
scene-graph
scene-graph
scene-graph
event-handlers#mySVG1:
var svg = d3.select("#mySVG1");
//2 nodes
svg.append("circle").attr({r:15,cx:500,cy:20}).style("fill","blue")
svg.append("circle").attr({r:15,cx:20,cy:20}).style("fill","orange")
//1 edge
var edge = svg.append("g").attr("class","edge")
edge.append("line").attr({x1:35,x2:485,y1:20,y2:20}).style("stroke","black").style("stroke-width","3px")
edge.append("text").attr({x:220,y:20}).text("edge")
var svg = d3.select("#mySVG1");
svg.style("cursor","progress").on("click", function (){alert("clicked on svg");})
svg.selectAll("circle").style("cursor","pointer").on("click", function (){
	alert("clicked on node");
	d3.event.stopPropagation();
})
svg.selectAll("g.edge").style("cursor","cell").on("click", function (){
	alert("clicked on edge")
	d3.event.stopPropagation();
})
technology #2: D3
Selections
var sel = d3.selectAll("h3").style("color", "orange");
Selections with dynamic properties
var sel = d3.selectAll("h3").style("color",function(d,i){
	return (i % 2 == 0) ? "magenta" : "blue"
});
D3+SVG
remove,append,transitions#svg1:
d3.select("#svg1").select("circle").remove();
d3.select("#svg1").append("circle")
  .attr({"r":15,"cy":20,"cx":Math.random()*800})
var colors = d3.scale.category20();
d3.select("#svg1").selectAll("circle")
  .transition().duration(3000)
  .style("fill",function(d,i){
     return colors(i);
  })
  .attr("cx",function(d,i){
    return i*30+15
  })
  .attr("r",function(d,i){
    return Math.random()*10+5;
  })
Selections bound to data
var sel = d3.select("#myList").selectAll("li")
.data(["red","green","blue"])
.style("color",function(d,i){
	return d;
})
- First item
- Second item
- Third item
Enter and Exit Selections
thinking with joins and the general update pattern
function update(data) {

  // DATA JOIN
  // Join new data with old elements, if any.
  var text = svg.selectAll("text")
      .data(data, function(d) { return d; });

  // UPDATE
  // Update old elements as needed.
  text.attr("class", "update")
    .transition()
      .duration(750)
      .attr("x", function(d, i) { return i * 32; });

  // ENTER
  // Create new elements as needed.
  text.enter().append("text")
      .attr("class", "enter")
      .attr("dy", ".35em")
      .attr("y", -60)
      .attr("x", function(d, i) { return i * 32; })
      .style("fill-opacity", 1e-6)
      .text(function(d) { return d; })
    .transition()
      .duration(750)
      .attr("y", 0)
      .style("fill-opacity", 1);

  // EXIT
  // Remove old elements as needed.
  text.exit()
      .attr("class", "exit")
    .transition()
      .duration(750)
      .attr("y", 60)
      .style("fill-opacity", 1e-6)
      .remove();
}
Enough technology
lets do math
network flows
digraph \(G = (V, E)\)
network flows
digraph \(G = (V, E)\)
A flow network \( N=(G,c,s,t) \)
- capacity \(\forall e \in E: c(e) \geq 0 \)
- source and sink \( s,t \in V \)
A flow on N: \( f : E \rightarrow \mathbb{R}_o^+ \)
- feasability / capacity constraints: \( \forall e \in E : f(e) \leq c(e) \)
- flow conservation: \( \forall u \in V \setminus \{s,t\} : \sum_{v \in V} f(u,v) = \sum_{v \in V} f(v,u)\)
Maximum flow
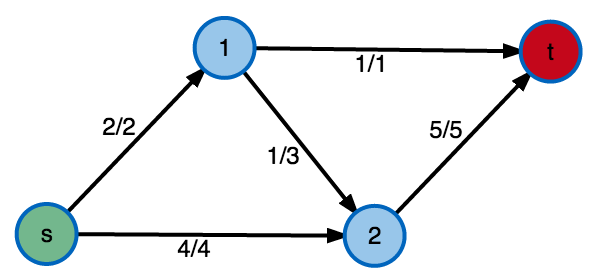
\( \max flow = \) 6 \( = \min cut\) \( = {\sum_{v \in V} f(s,v) } = {\sum_{v \in V} f(v,t) }\)
Push-Relabel algorithm
of Goldberg-Tarjan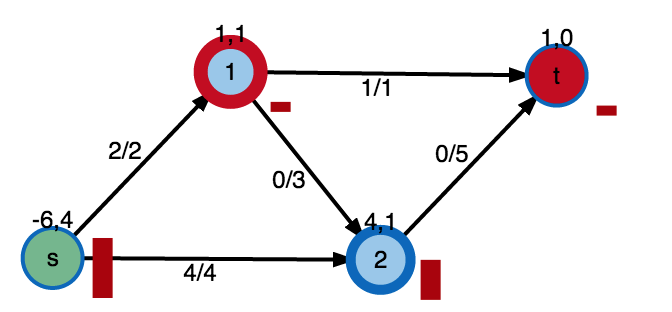
- exess \( e(u) = \sum_{v \in V} f(u,v) - \sum_{v \in V} f(v,u), u \in V \)
- flow conservation: \( \forall u \in V \setminus\{s,t\}: e(u) = 0\)
- flow conservation, instead preflow: \( \forall u \in V \setminus\{s,t\}: e(u) \geq 0\)
- height \( h(u), u \in V \)
Push-Relabel algorithm
of Goldberg-Tarjanwhile \( \exists v \in V \setminus \{s,t\}\) with \(e(v) > 0 \)
- \( \forall (v,w) \in E \): push \( min(e(v),c(v,w)) \) exess flow to neighbours when h(v)=h(w)+1
- relabel v to \( 1+max(h(w)) \) if it has still exess
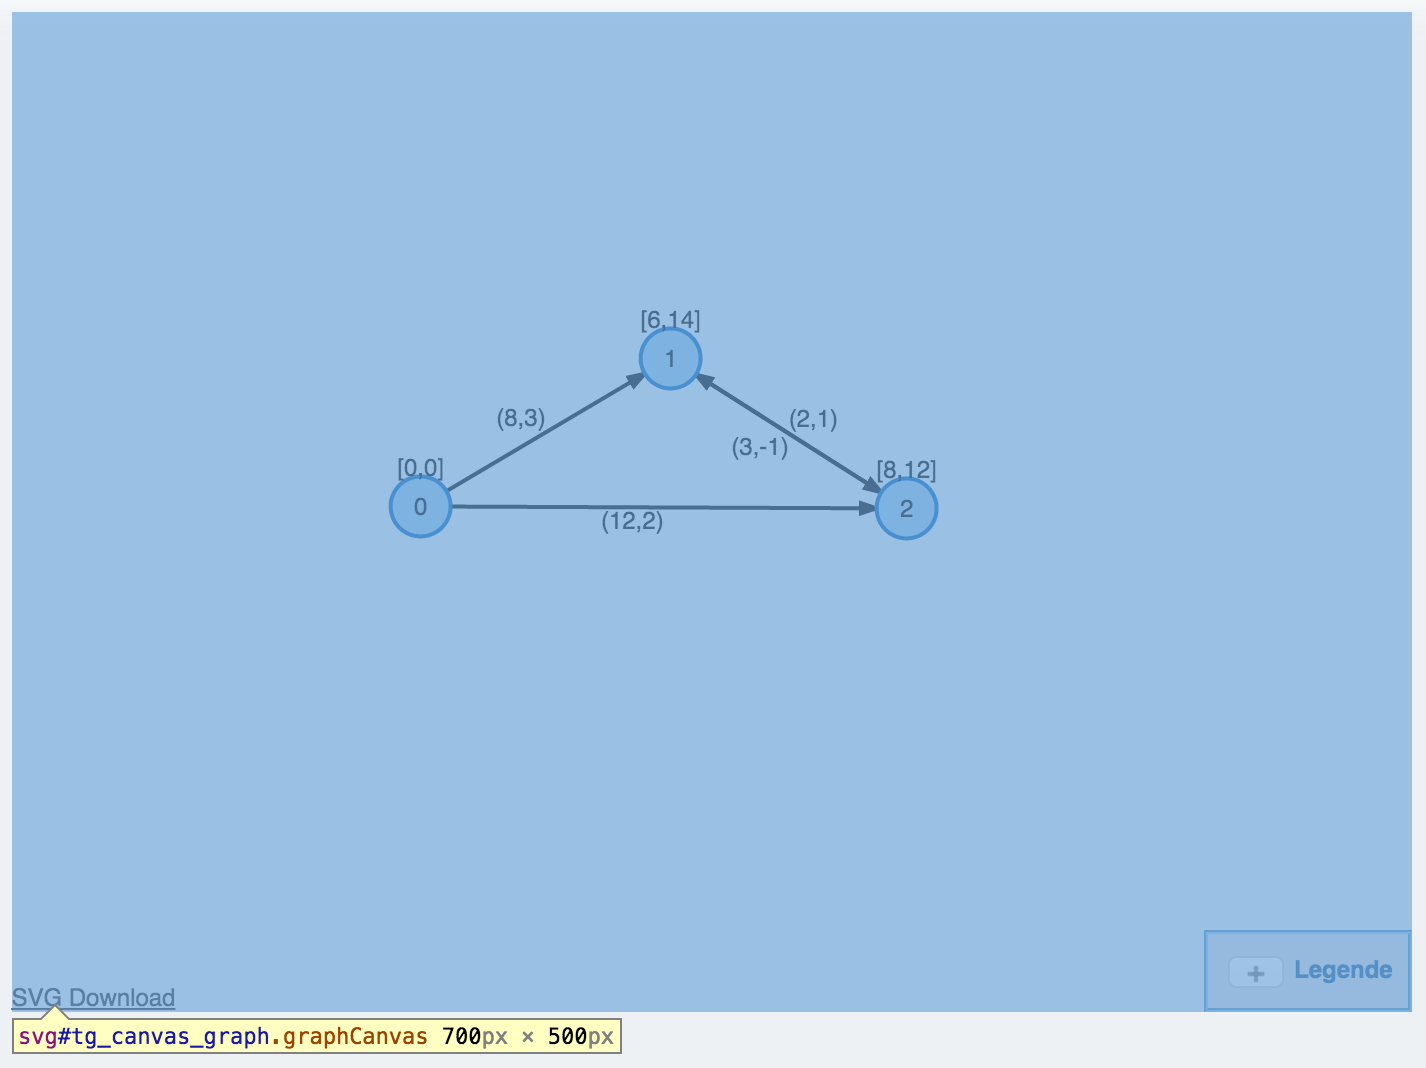
Shortest Paths
with resource constraints (SPPRC)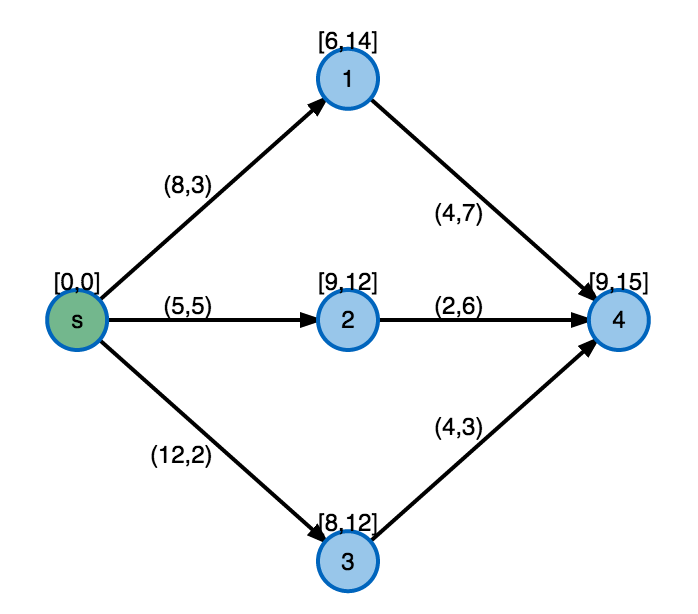
edges carry n-d resource vectors:
- accumulated along paths
- constrained at intermediate nodes
Shortest Paths
with time windows (SPPTW)edges carry 2-d (time,cost) resource vectors:
- time constrained at nodes [arrival,departure]
- cost unconstrained but seeks to be minimized
Shortest Paths
with time windows (SPPTW)find paths \( P=(v_0,v_1,v_2,... ,v_n), s=v_0, t=v_n \) s.t.:
- \( \forall v_j \in P: arr(v_j) \leq \sum_{i=1}^{j}{time(v_{i-1},v_{i})} \leq dep(v_j) \)
- \( cost(P) = \min{\sum_{i=1}^{n}cost(v_{i-1},v_i)} \)
Label-Setting Algorithm
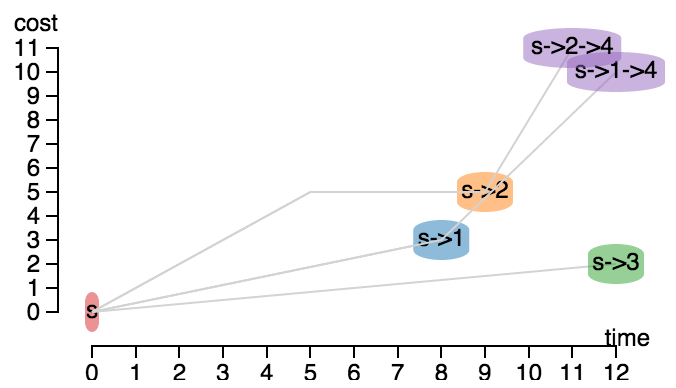
A tree of labels to store and manage paths:
- rooted at s
- ending in a resident node v
- carry accumulated resources
Label-Setting Algorithm
While \(\exists \) unprocessed labels of paths P = (s,...v) in G:
- extend P from v using outgoing edges (v,w)
- keep if they are resource-feasible in w
- discard labels wich are dominated in both time and cost
Graph Editor
arbitrary #resources | upload/download | svg export LINKOutlook: 2.5D
CSS 3D Transforms of SVG Layers | D3.js, Three.js and CSS 3D Transforms
Outlook: 3D!
 |
d3 + x3dom |